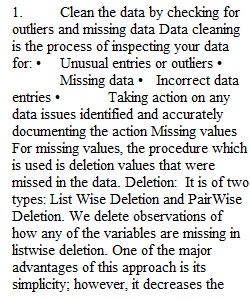
Q Assignment: Final Project Second Assignment Written Assignment Click for more options Final Project Second Assignment Research Project Second Assignment In this week’s research project assignment, you are required to: 1. Clean the data by checking for outliers and missing data Data cleaning is the process of inspecting your data for: Unusual entries or outliers Missing data Incorrect data entries Taking action on any data issues identified and accurately documenting the action taken. For more information on data cleaning and exploration, read the article in the following link https://www.analyticsvidhya.com/blog/2016/01/guide-data-exploration/ 2. Explore your project data set and summarize it using descriptive statistics, graphs, etc. You will need to provide summary statistics of each variable in your data set. There are many ways to summarize your data and you are encouraged to be creative but also accurate in how you summarize and present your data. In general: A categorical variable is summarized using a frequency table and visualized using bar charts and pie charts A pair of categorical variables is summarized using a contingency table A numeric variable is summarized using descriptive statistics: measures of central tendency (mean, median, and mode), measures of variation or dispersion (range, standard deviation), and measures of position (z-scores, percentiles). A histogram, dot plot or stem-and-leaf plot, are used to provide visual information on the distribution of a variable An outlier can easily be identified using a box plot Visual inspection of histogram can also be used to assess if a variable is normally distributed A pair of numeric variables is summarized using a scatter plot A scatter plot is usually a good indicator of whether two variables are correlated or not Deliverable Word document containing: A detailed discussion of data cleaning procedures used Summary statistics and visualizations (tables, graphs, charts, etc.) of all the variables in your data set. Ensure that you use proper APA formatting and titles for tables and figures.
View Related Questions